
Study Measurable Behavior
A practical framework for reading drought leaders, multipliers, and pressure maps through measurable evidence instead of superstition language.
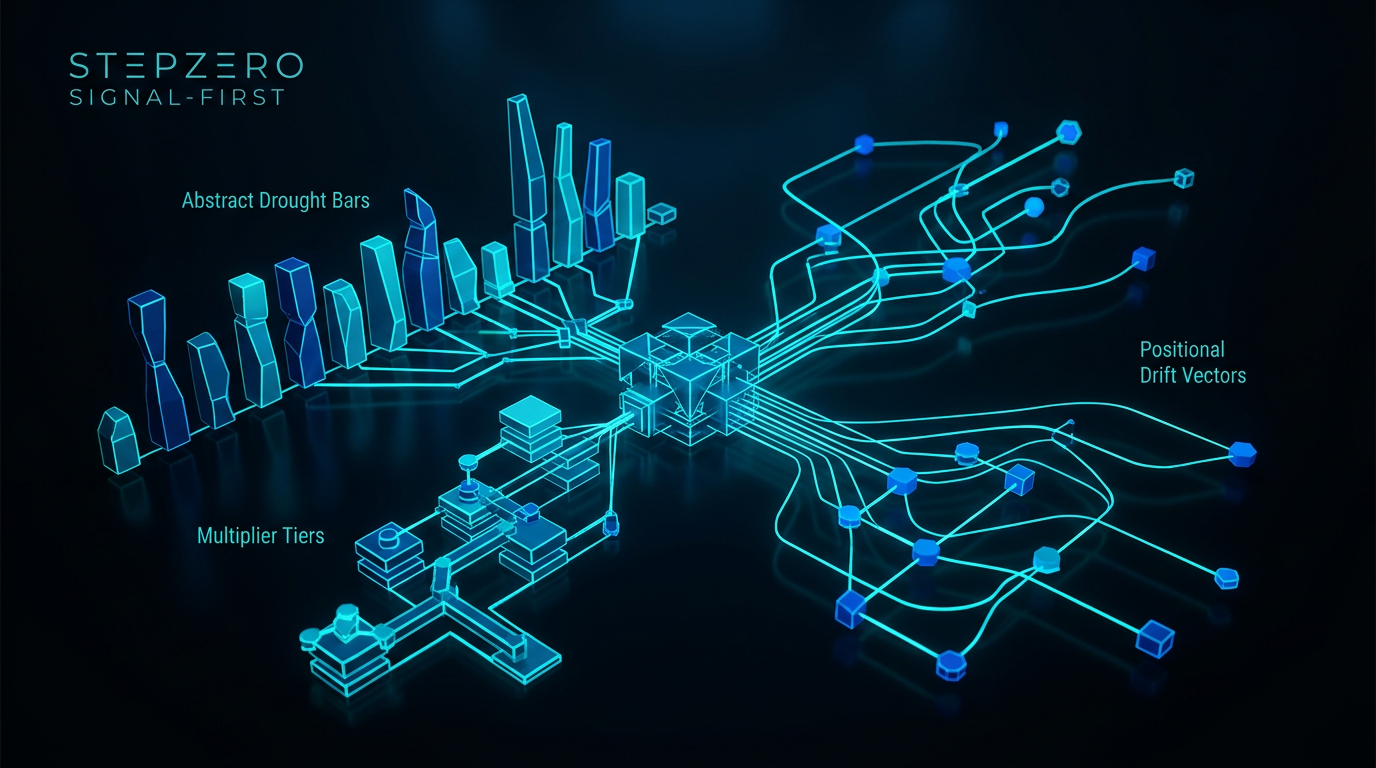
Featured article visual
How often, how long since, and where — three plain measurements that make behavior readable at a glance.
From Myth to Measurement
Measurable behavior starts by replacing due-language with observables. We track depth, frequency, and position behavior directly and avoid prediction claims.
This gives users a disciplined lens: rarity can be measured, pressure can be mapped, and comparison can be normalized.
Leader and Multiplier as Core Signals
The drought leader is the highest pressure point in the table at any moment. Multiplier translates depth into a normalized rarity scale across windows and eras.
- Leader identity shows where top pressure sits.
- Multiplier shows how extreme that pressure is.
- Reign and succession describe how pressure moves over time.
Pressure Maps and Tail Events
Pressure maps help visualize concentration and instability bands. Tail events mark the far edge of structural distribution and should be interpreted as extremity, not certainty.
Diagnostic views combine these dimensions into one explainable snapshot for Oracle and reports.
Oracle Query Starters
- Who is the current drought leader and what is the multiplier for AZ-FANTASY5?
- Show active tail events above 10x for AZ-FANTASY5.
- Give me a diagnostic view for combo 3, 11, 19, 27, 34 in AZ-FANTASY5.
Glossary Terms in This Article
Curriculum Navigation
Previous: Clean Historical Context